matplotlib の 棒グラフ でx軸に日付をとりたいんだけど
matplotlib の pyplot.bar で棒グラフを描く際、x軸に日付の入った pandas の Series をそのまま渡して問題なく動いていたのだけれど、 ある日から突然動作しなくなった。多分 conda update anaconda かけたタイミングだと思うのだが、バージョンとか無頓着で全然わからん。
values使ったら動くようになったからいいけど……。なんで?
import pandas as pd
import matplotlib.pyplot as plt
#エクセルを読み込む。日単位のデータをグラフにしたい。
df = pd.read_excel("test.xlsx")
df
| seq | accessdate | a | b | |
|---|---|---|---|---|
| 0 | 1 | 2018-06-01 | 430 | 68 |
| 1 | 2 | 2018-06-02 | 285 | 80 |
| 2 | 3 | 2018-06-03 | 125 | 89 |
| 3 | 4 | 2018-06-04 | 487 | 57 |
| 4 | 5 | 2018-06-05 | 477 | 1 |
| 5 | 6 | 2018-06-06 | 159 | 4 |
| 6 | 7 | 2018-06-07 | 332 | 98 |
| 7 | 8 | 2018-06-08 | 224 | 18 |
| 8 | 9 | 2018-06-09 | 106 | 3 |
#各列の型はこんな感じ
df.dtypes
seq                    int64
accessdate    datetime64[ns]
a                      int64
b                      int64
dtype: object
#x軸にseqを与える。動く。
plt.bar(df.seq,df.a)
<BarContainer object of 9 artists>
#x軸にaccessdateを与える。動かない。以前は動いていた。
#型のことで怒られていそうなのはわかるが、何か仕様がかわったのか。
plt.bar(df.accessdate,df.a)
---------------------------------------------------------------------------

TypeError                                 Traceback (most recent call last)

<ipython-input-25-78e092c13e1a> in <module>()
----> 1 plt.bar(df.accessdate,df.a)


~\Anaconda3\lib\site-packages\matplotlib\pyplot.py in bar(*args, **kwargs)
   2768                       mplDeprecation)
   2769     try:
-> 2770         ret = ax.bar(*args, **kwargs)
   2771     finally:
   2772         ax._hold = washold


~\Anaconda3\lib\site-packages\matplotlib\__init__.py in inner(ax, *args, **kwargs)
   1853                         "the Matplotlib list!)" % (label_namer, func.__name__),
   1854                         RuntimeWarning, stacklevel=2)
-> 1855             return func(ax, *args, **kwargs)
   1856
   1857         inner.__doc__ = _add_data_doc(inner.__doc__,


~\Anaconda3\lib\site-packages\matplotlib\axes\_axes.py in bar(self, *args, **kwargs)
   2257         if align == 'center':
   2258             if orientation == 'vertical':
-> 2259                 left = x - width / 2
   2260                 bottom = y
   2261             elif orientation == 'horizontal':


TypeError: ufunc subtract cannot use operands with types dtype('<M8[ns]') and dtype('float64')
#x軸にaccessdate.valuesを与える。動く。
plt.bar(df.accessdate.values,df.a)
<BarContainer object of 9 artists>
#こっちはpandasのSeriesだけど、
type(df.accessdate)
pandas.core.series.Series
#valuesだと numpy.ndarray
type(df.accessdate.values)
numpy.ndarray
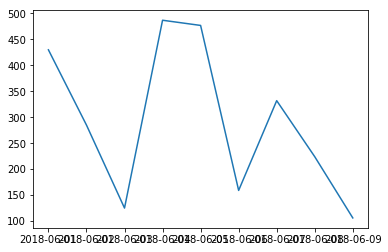
#lineだとそのまんまで動くんだよなー
plt.plot(df.accessdate, df.a)
[<matplotlib.lines.Line2D at 0x145329175c0>]
